Decoding landscapes, predicting flows.
I'm Fardin — a Civil and Water Resources Engineering graduate from MIST enthusiastic about GIS mapping, remote sensing, and hydraulic modelling. This is a record of the maps and studies I've built, from a field-measured hydraulics thesis to district-scale environmental mapping.

About
I graduated in Civil and Water Resources Engineering from the Military Institute of Science and Technology (MIST). My undergraduate thesis, co-authored with Shahriar Ahmed, examined flow velocity behaviour around a permeable groin-like structure.
Throughout my academic life, I've been building out GIS and remote-sensing skills alongside that hydraulic modelling background. I'm currently searching for similar work opportunities and fully funded graduate scholarships in Civil and water resources engineering, in Bangladesh and abroad.
Projects
Flow Velocity Analysis Around a V-Shaped Permeable Groin-Like Structure
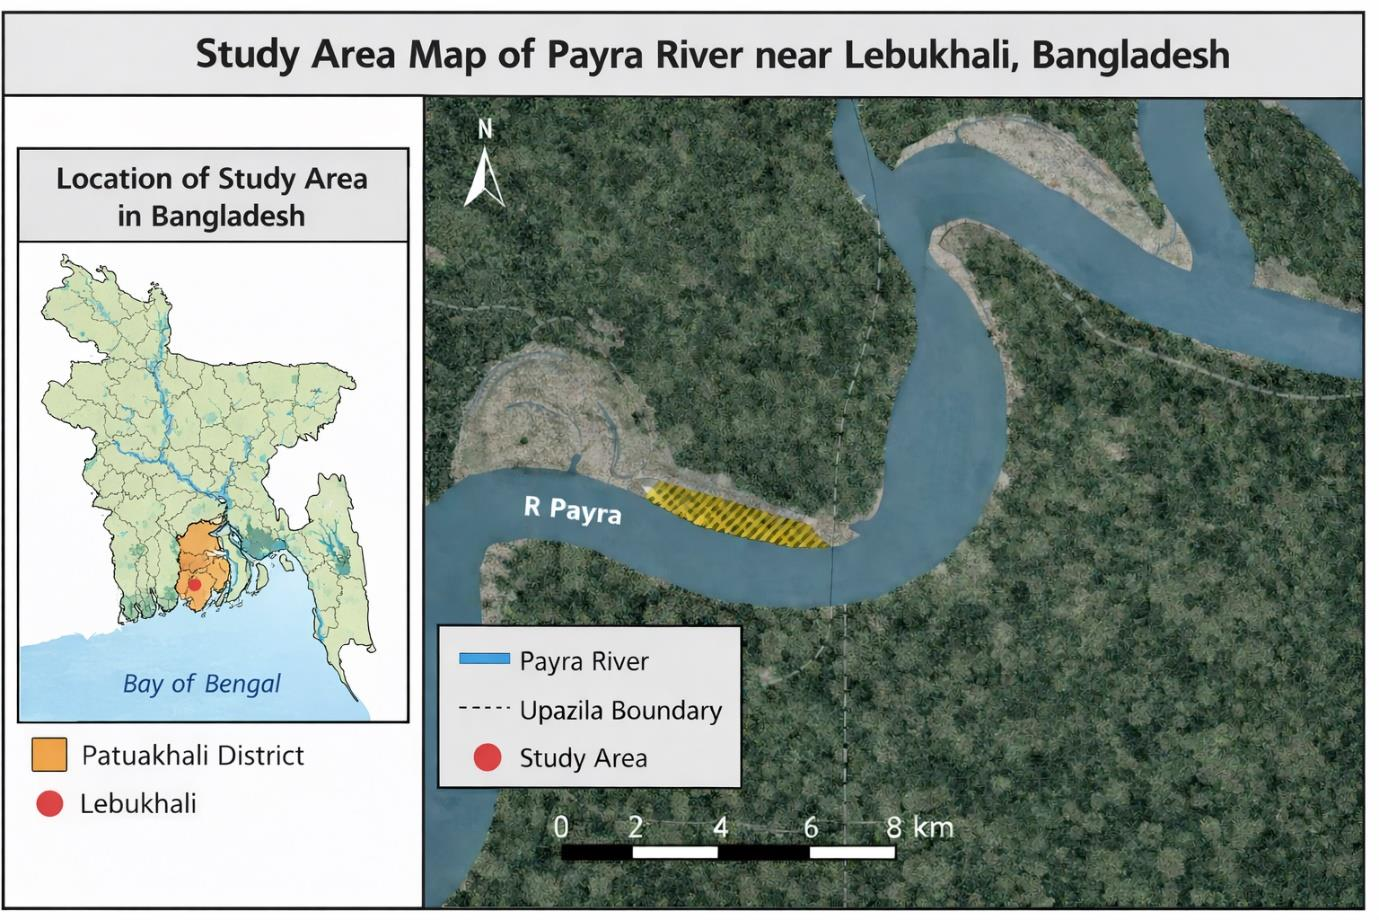
B.Sc. engineering thesis, co-authored with Shahriar Ahmed, supervised by Dr. Md. Kabirul Islam, EWCE Department, MIST. Compared the 3D flow velocity field — longitudinal (X), transverse (Y), and vertical (Z) — around a V-shaped bandal-like groin in both Perforated (permeable) and Drum (solid) configurations, at three alignment angles (30°, 45°, 60°), across high and low tide, near the Lebukhali reach of the Payra River.
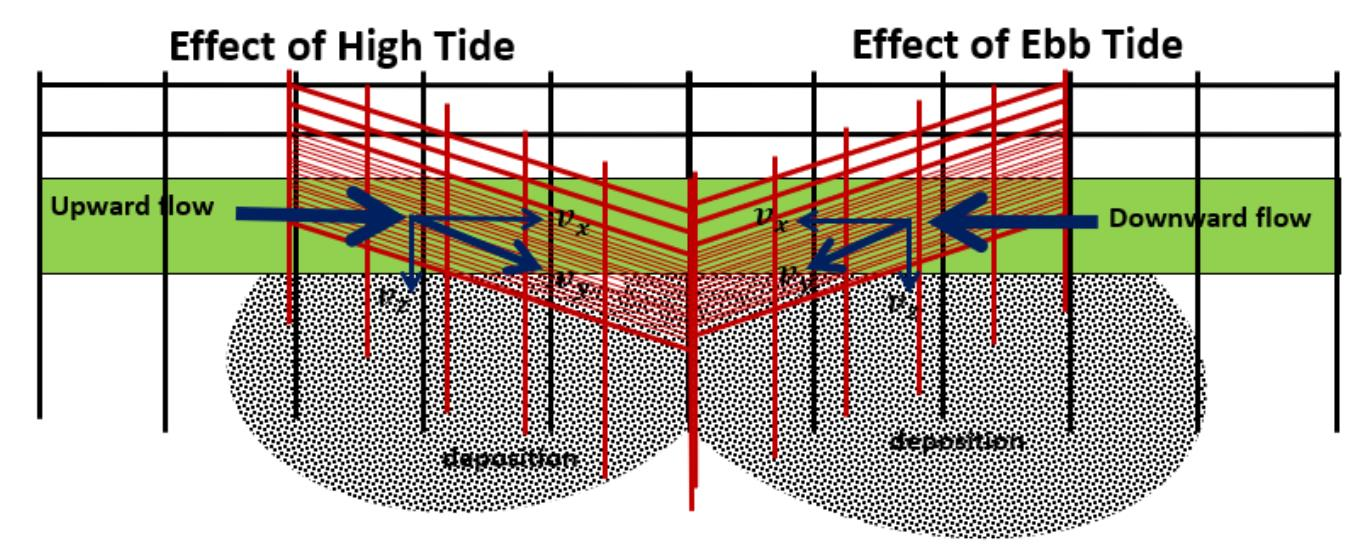
East/North/Up velocity data (from ADCP measurements, processed in WinRiver2) were transformed into local X/Y/Z components, then decomposed by the energy sharing concept to find each component's share of kinetic energy at every measurement point — across two structure types, three angles, two tide phases, two depth bands, and two positions along the structure.
Surface Drainage Hydraulics Model Simulation Using GeoSWMM — Dhaka City
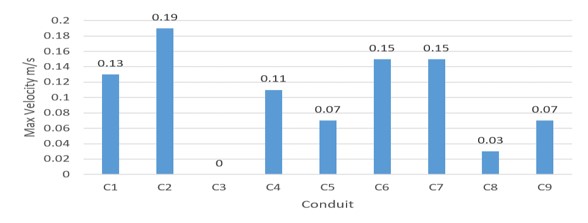
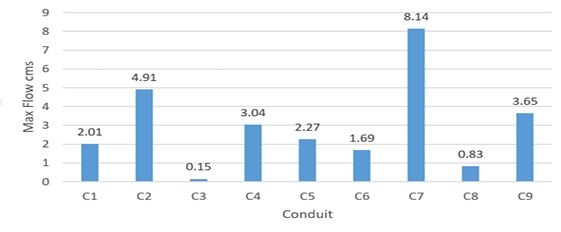
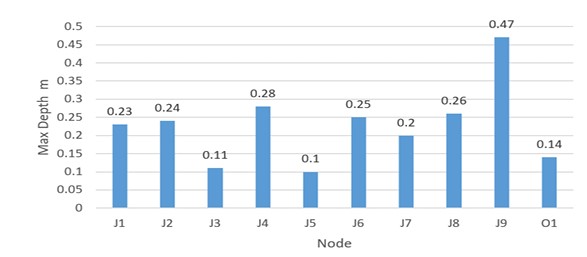
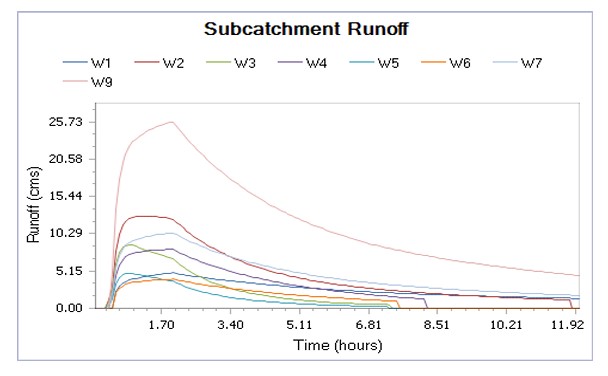
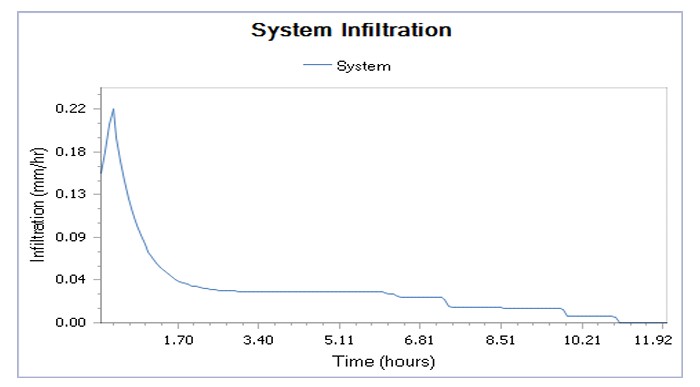
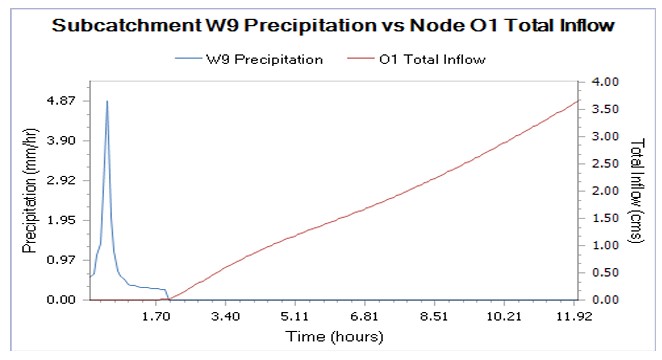
I built and simulated a surface drainage hydraulic model for a selected urban catchment in Dhaka using GeoSWMM (built on the EPA SWMM 5 engine) integrated with ArcMap 10.8. Delineated the watershed from a DEM sourced via USGS Earth Explorer, configured the drainage network (subcatchments, conduits, junctions, and outfalls), and ran a Kinematic Wave hydraulic simulation using Horton infiltration and a 10-year return period rainfall series.
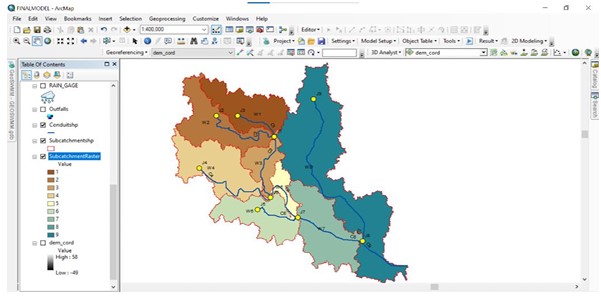
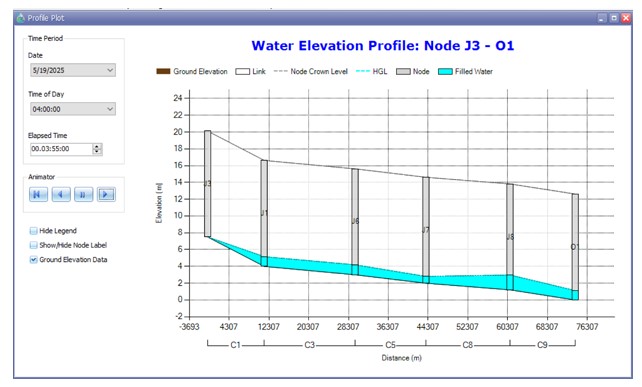
I verified model performance through the status report — a strong mass-balance continuity of -0.082% on runoff, with all conduits stable and no flooding or surcharging. I analyzed peak conduit velocities and flows, node depths, and subcatchment runoff to flag the most hydraulically loaded points in the network. I also diagnosed and corrected a flow-routing continuity error by refining conduit geometry, rebalancing subcatchment parameters, and adjusting the simulation time step.
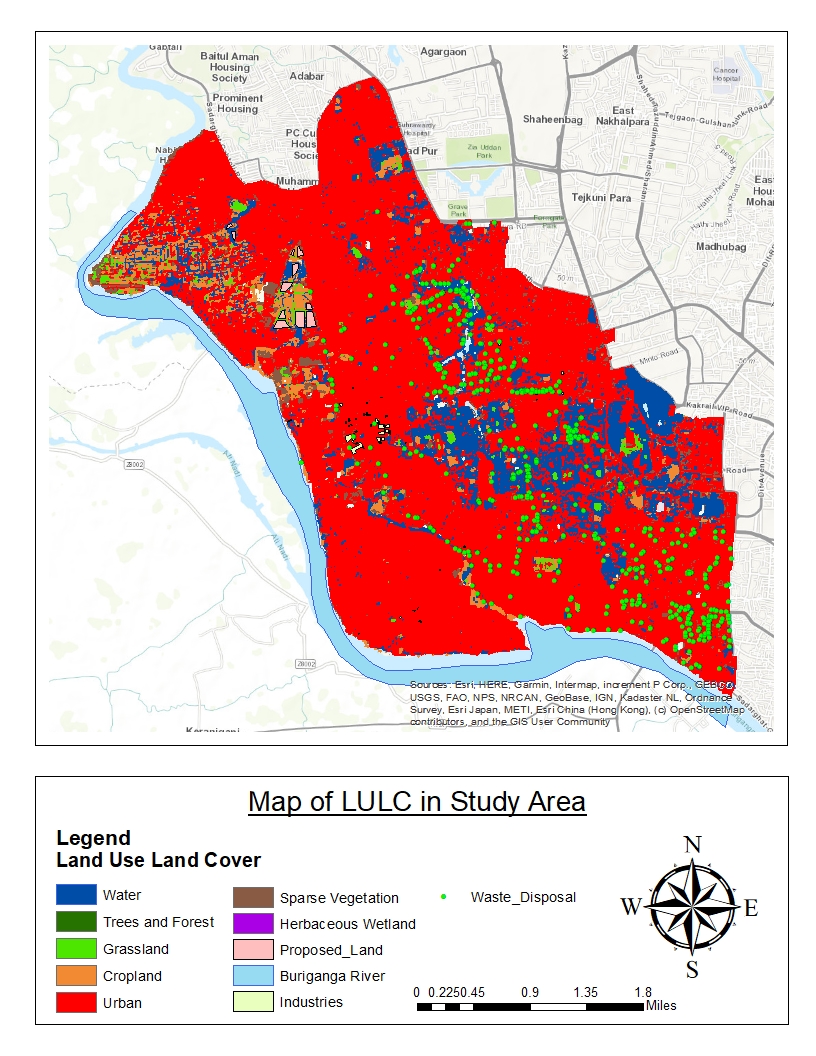
Buriganga River Pollution & Waste Disposal Site Suitability
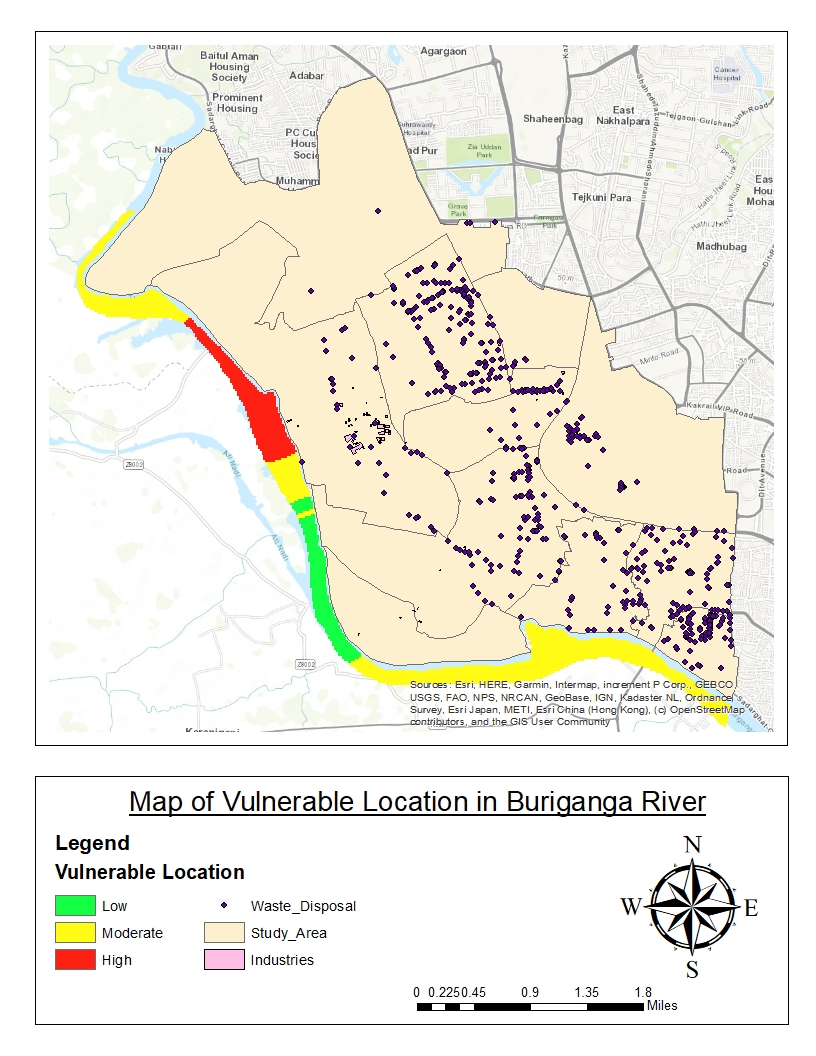
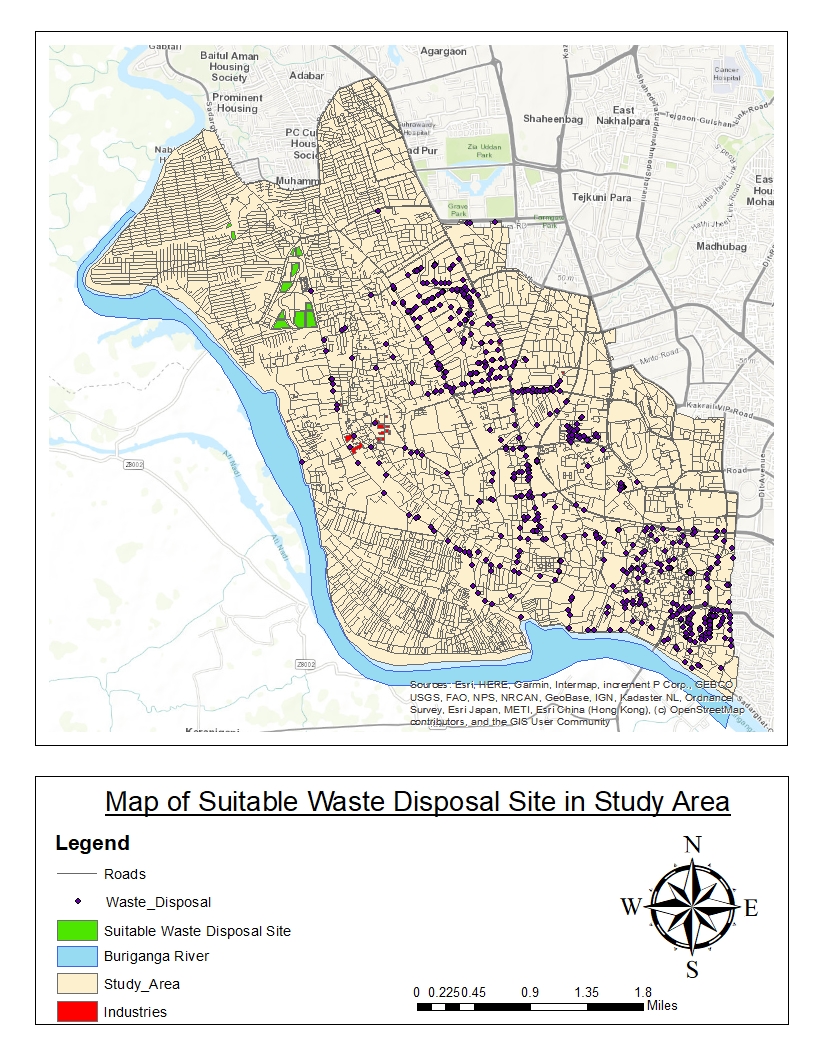
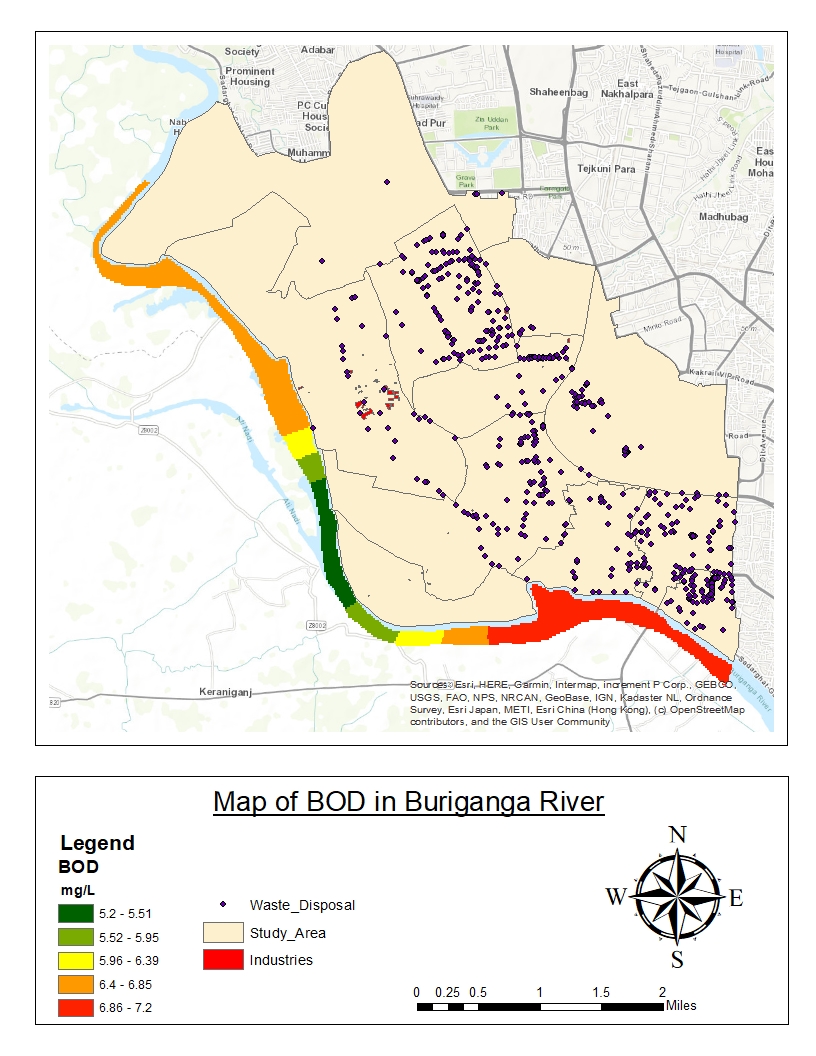
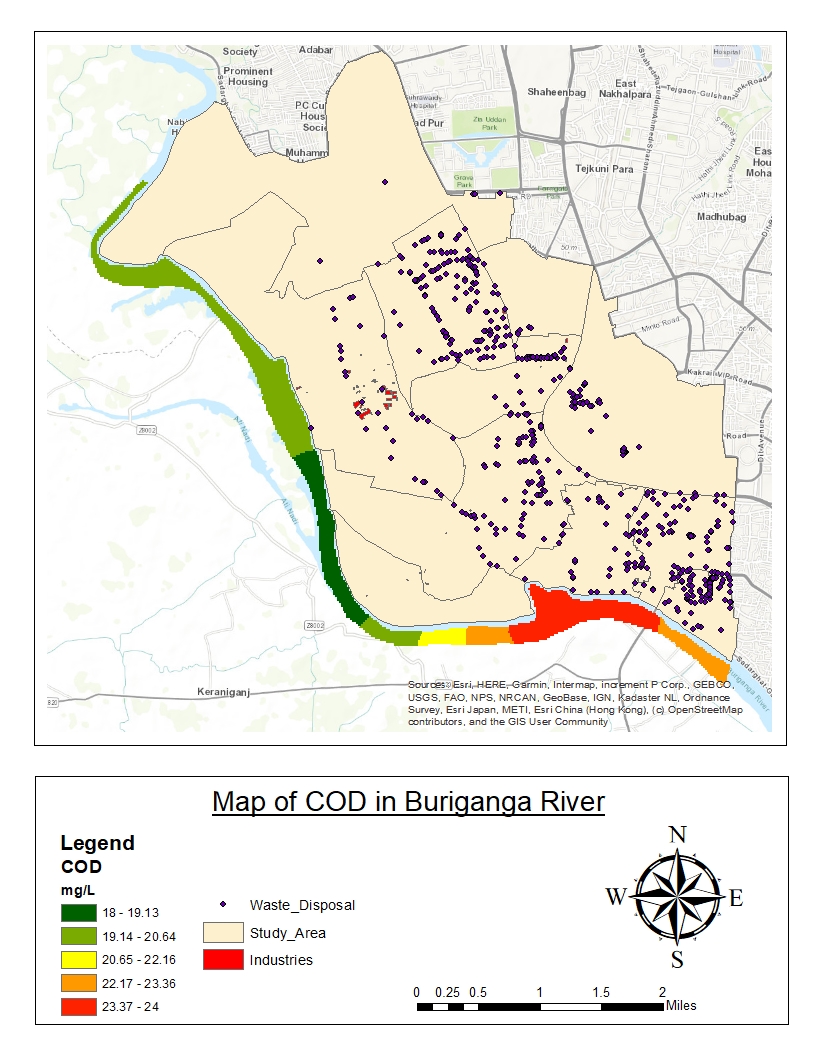
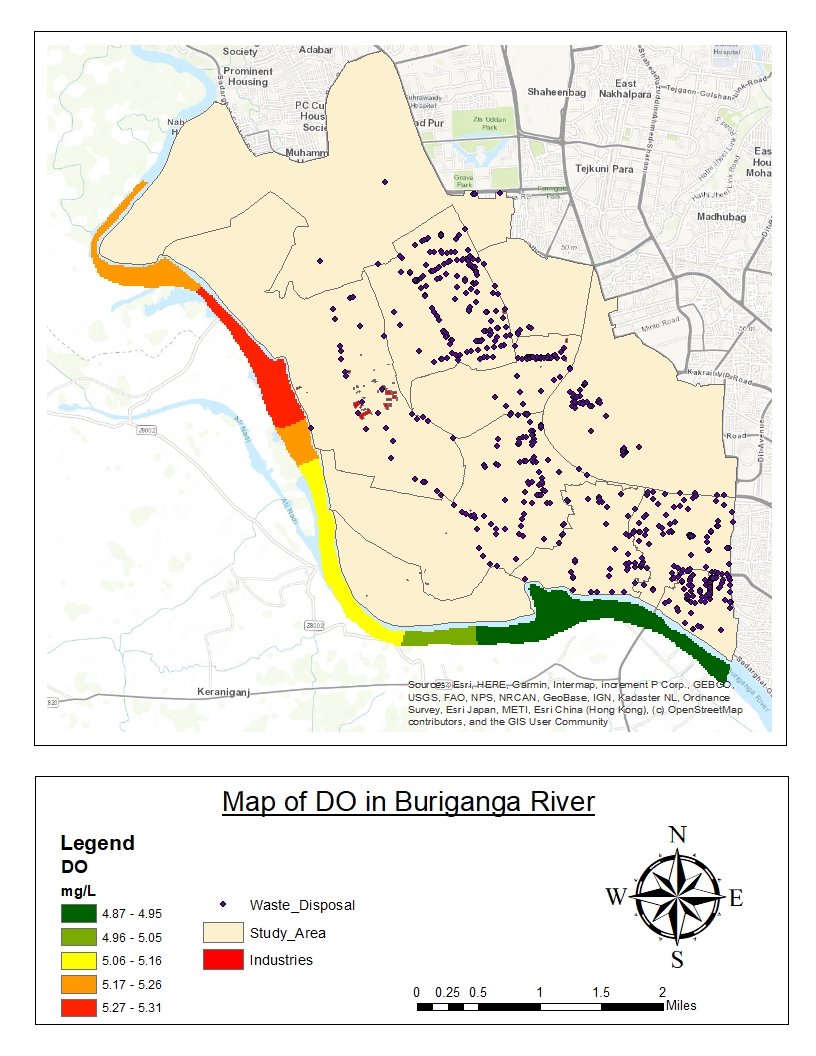
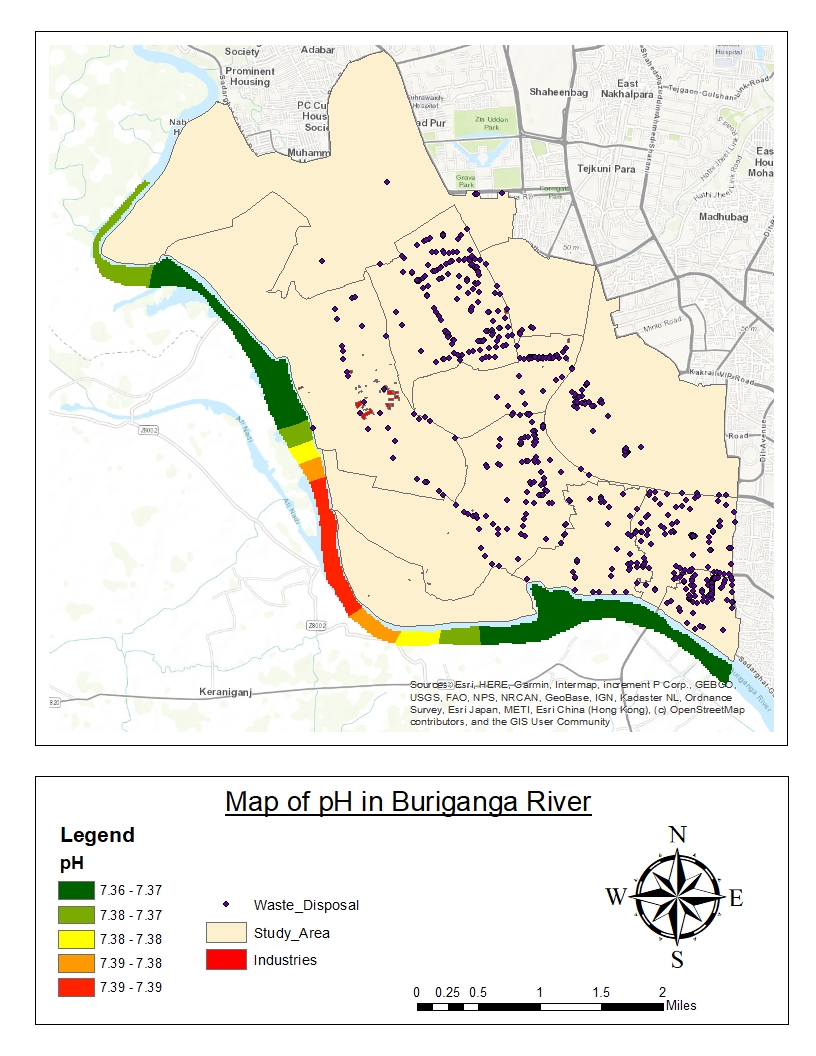
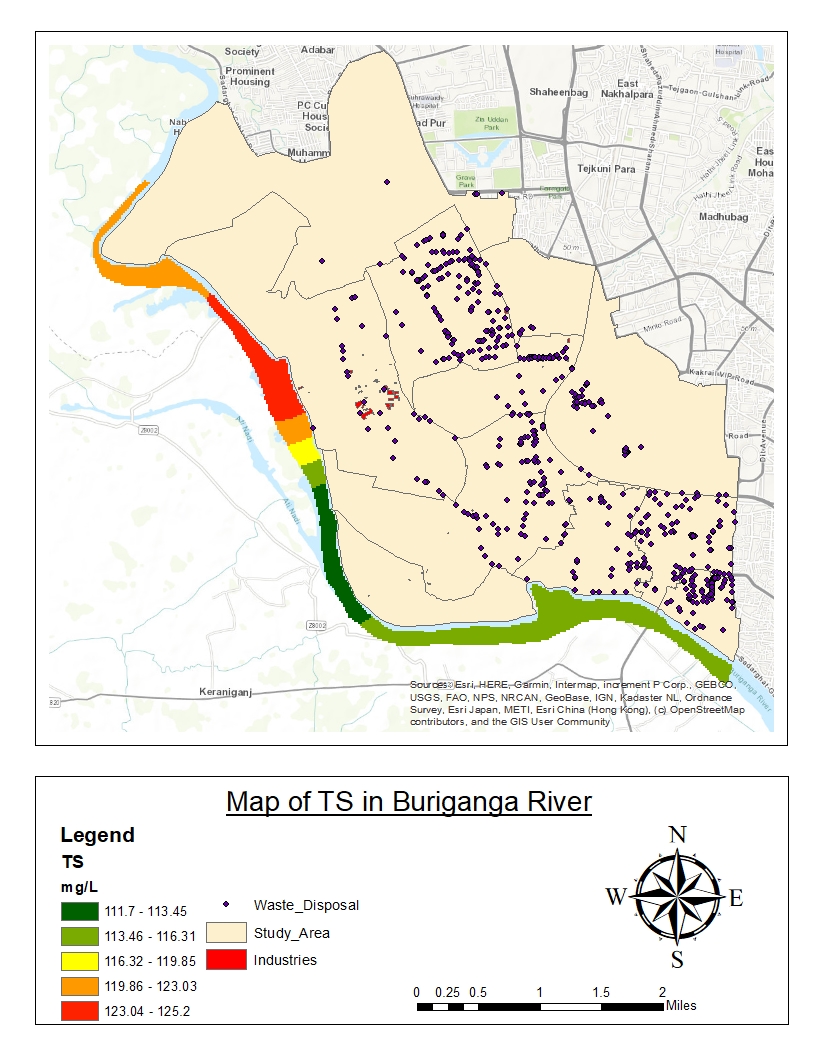
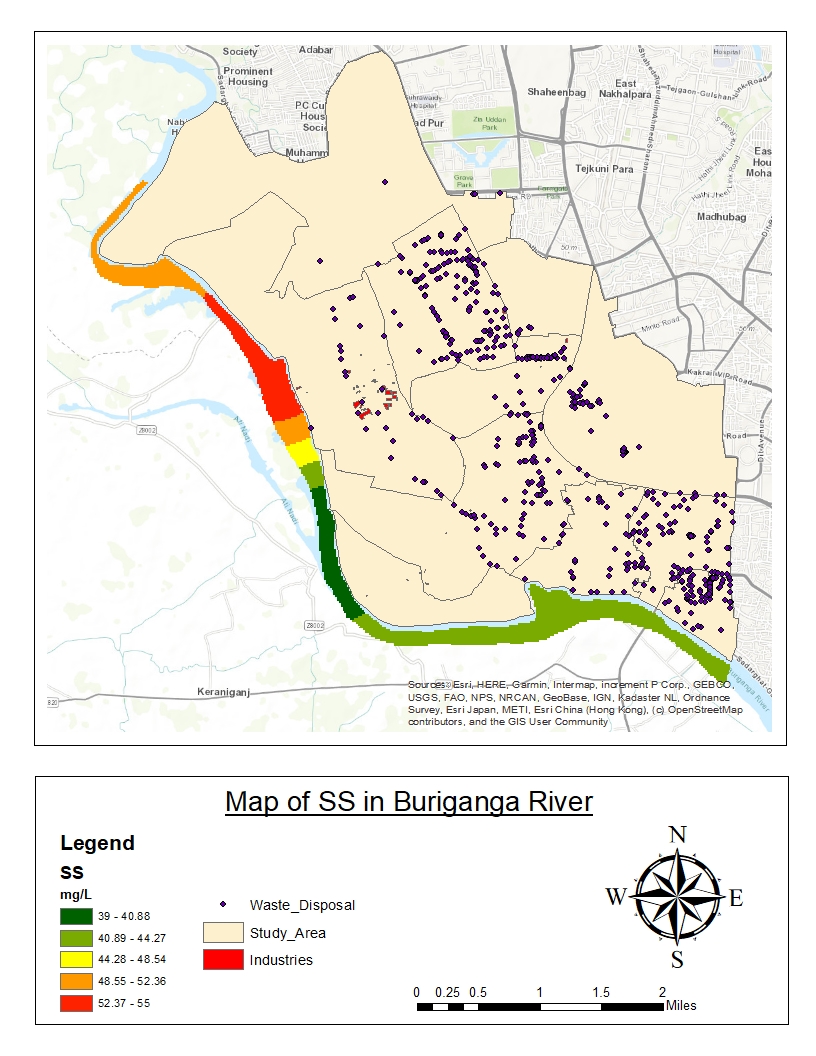
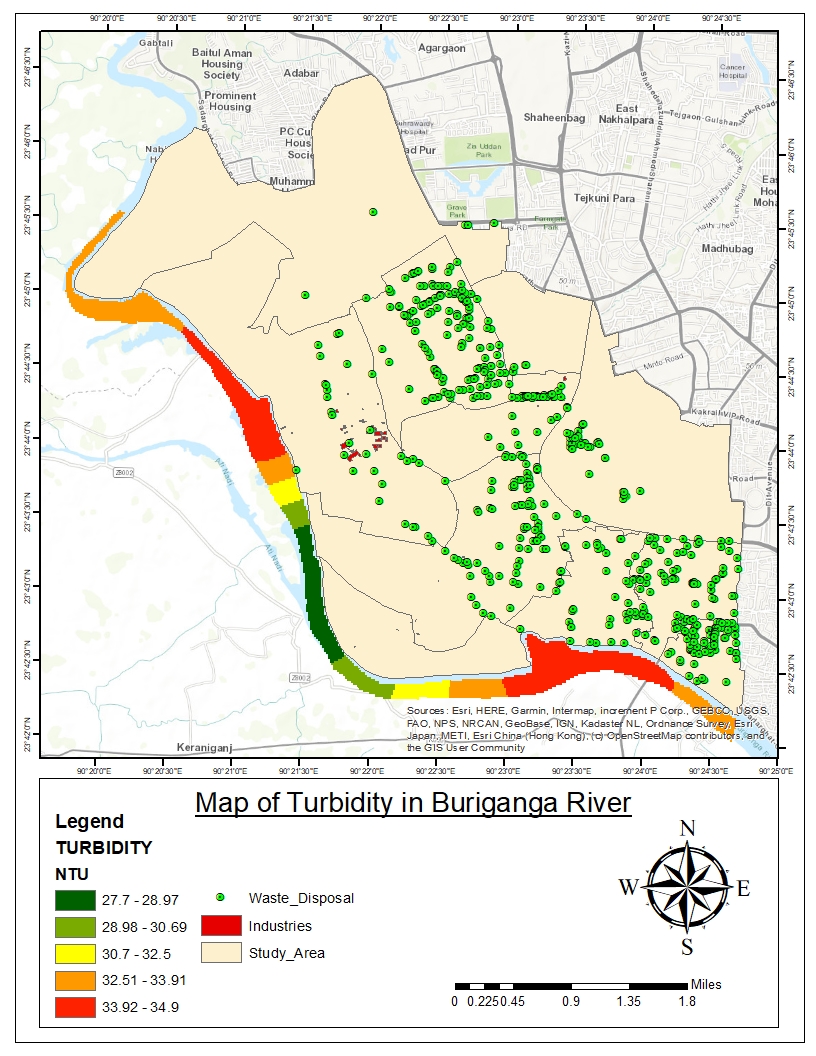
I mapped the spatial distribution of eight water quality parameters along the Buriganga River in Dhaka, identified the river's most environmentally vulnerable zones, and ran a multi-criteria suitability analysis to locate optimal waste disposal sites — weighing river proximity, industrial zones, road access, land use, and population density.
Land Use Land Cover Change — Netrokona District
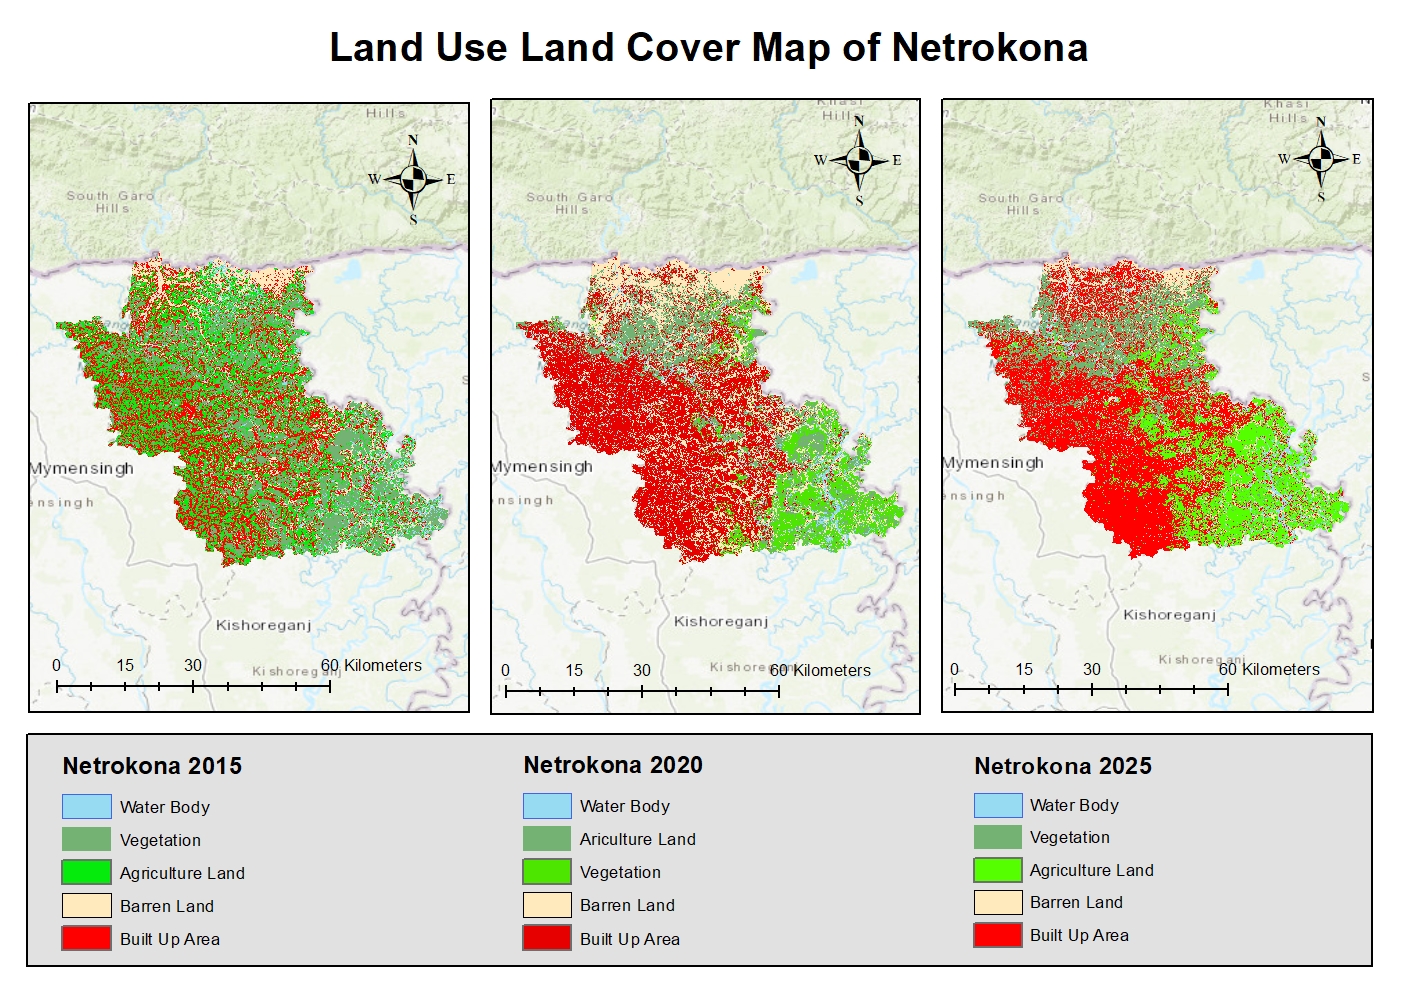
I classified and compared land cover across Netrokona district in 2015, 2020, and 2025.
Biophysical Indices Mapping — Netrokona District
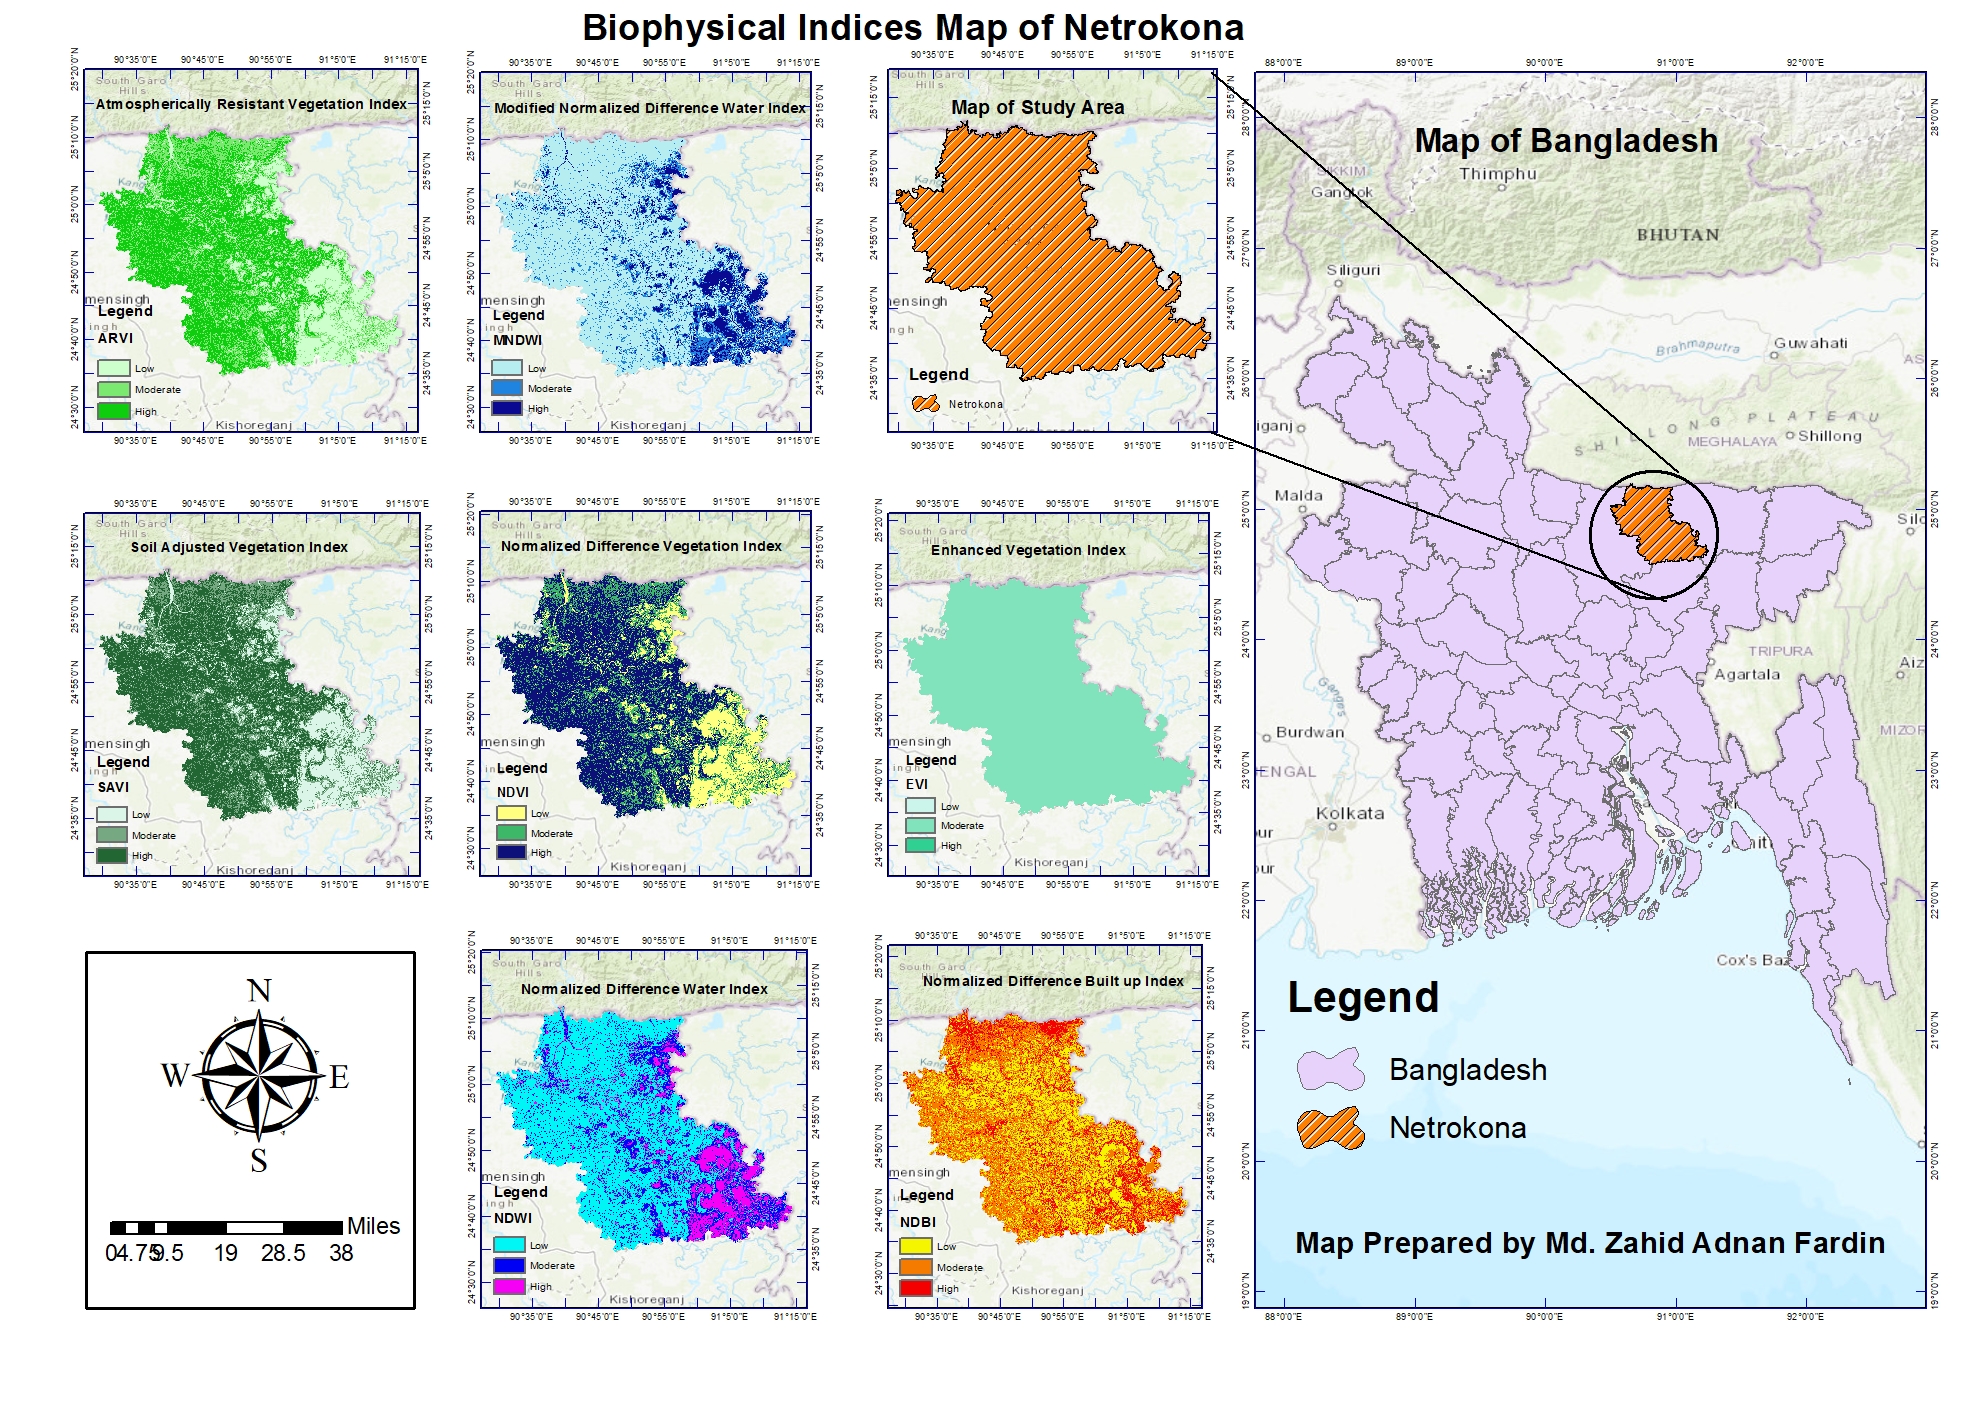
I derived a set of biophysical index maps for Netrokona district from satellite imagery — vegetation indices (ARVI, SAVI, NDVI, EVI), water indices (MNDWI, NDWI), and a built-up index (NDBI) using Google Earth Engine and ArcGIS.
NDVI & NDBI Comparison — Manchester
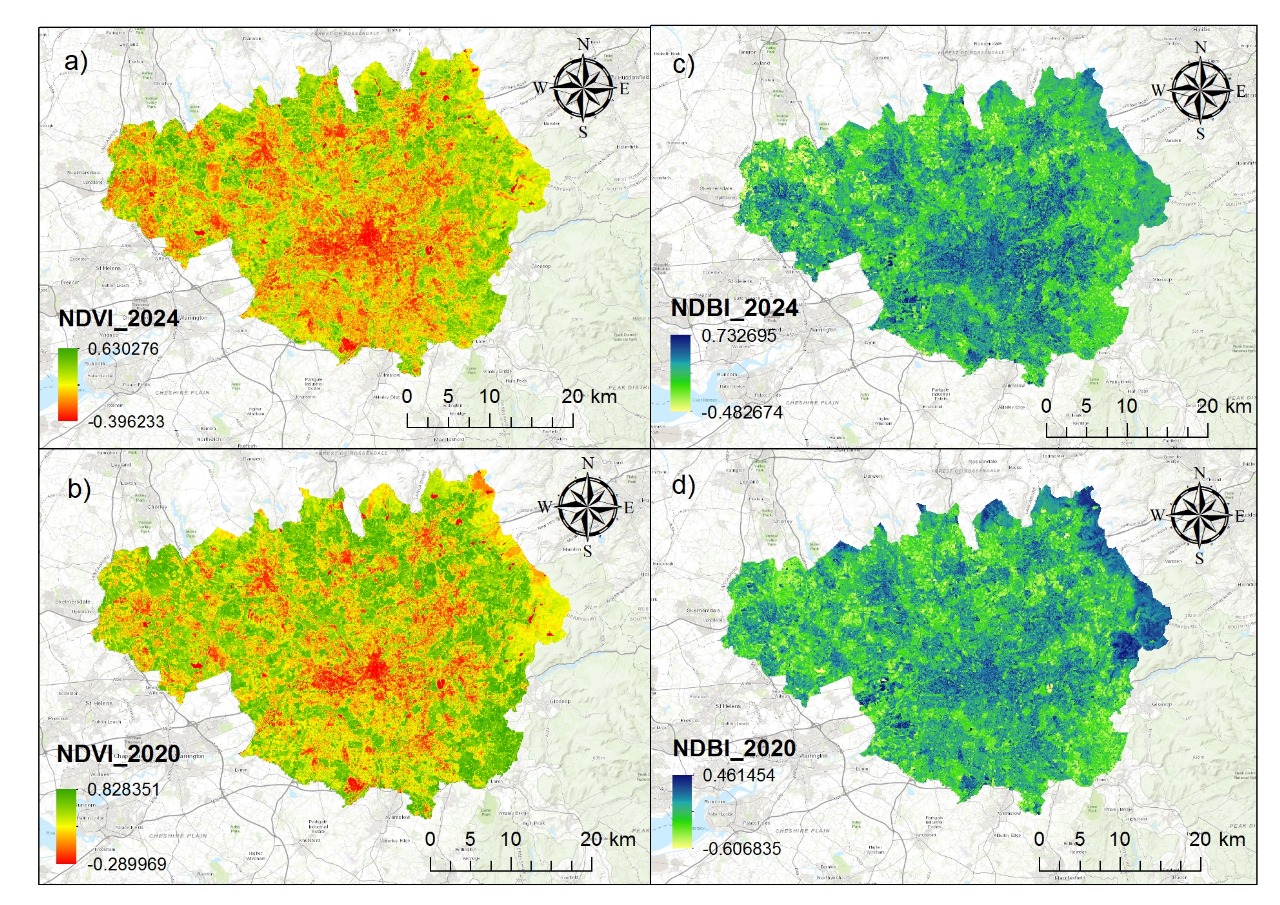
I compared NDVI and NDBI for Manchester between 2020 and 2024 to track change in vegetation and built-up extent over the four-year period.
NDVI & NDBI Comparison — Warsaw
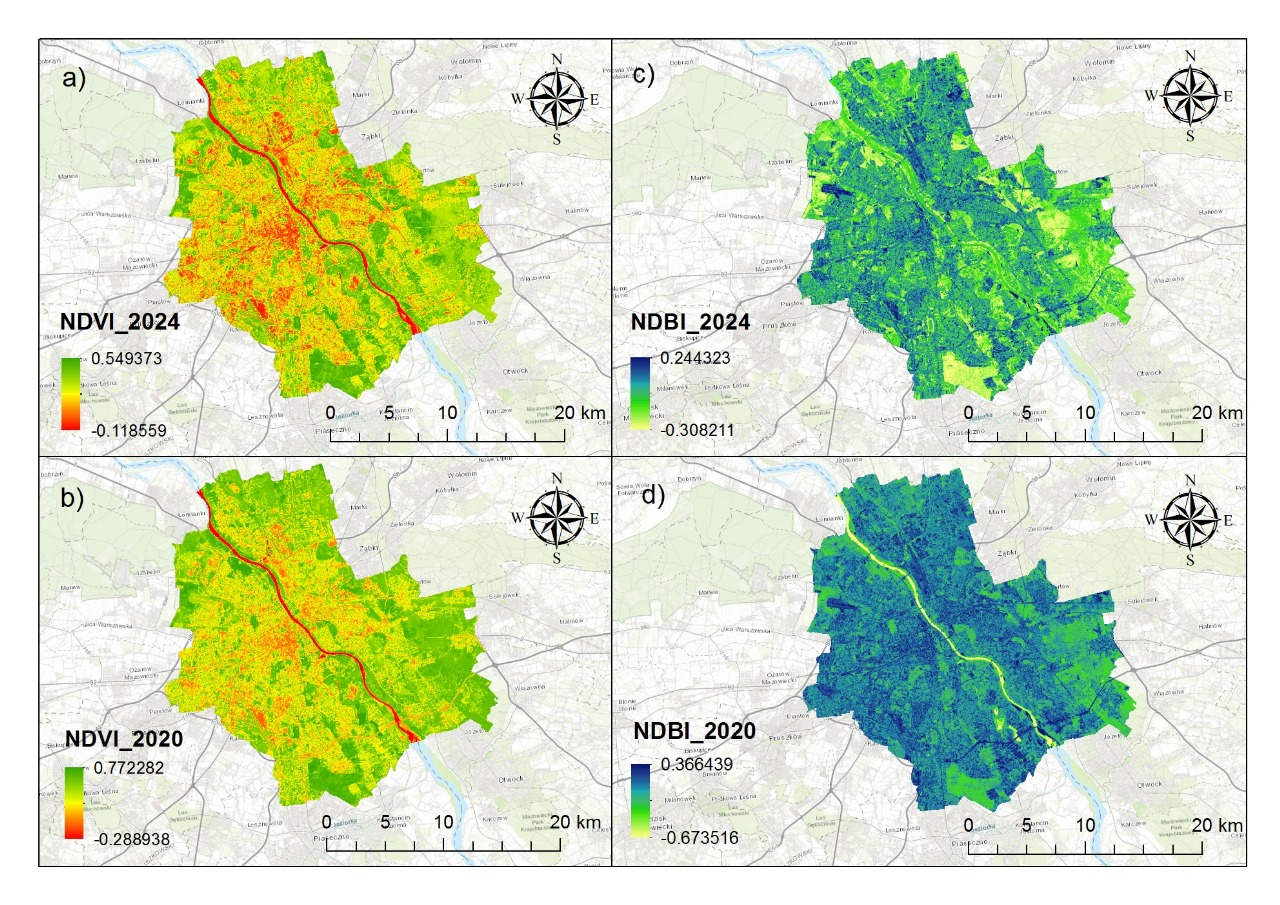
I compared NDVI and NDBI for Warsaw between 2020 and 2024 to track change in vegetation and built-up extent over the four-year period.
NDWI Map of France
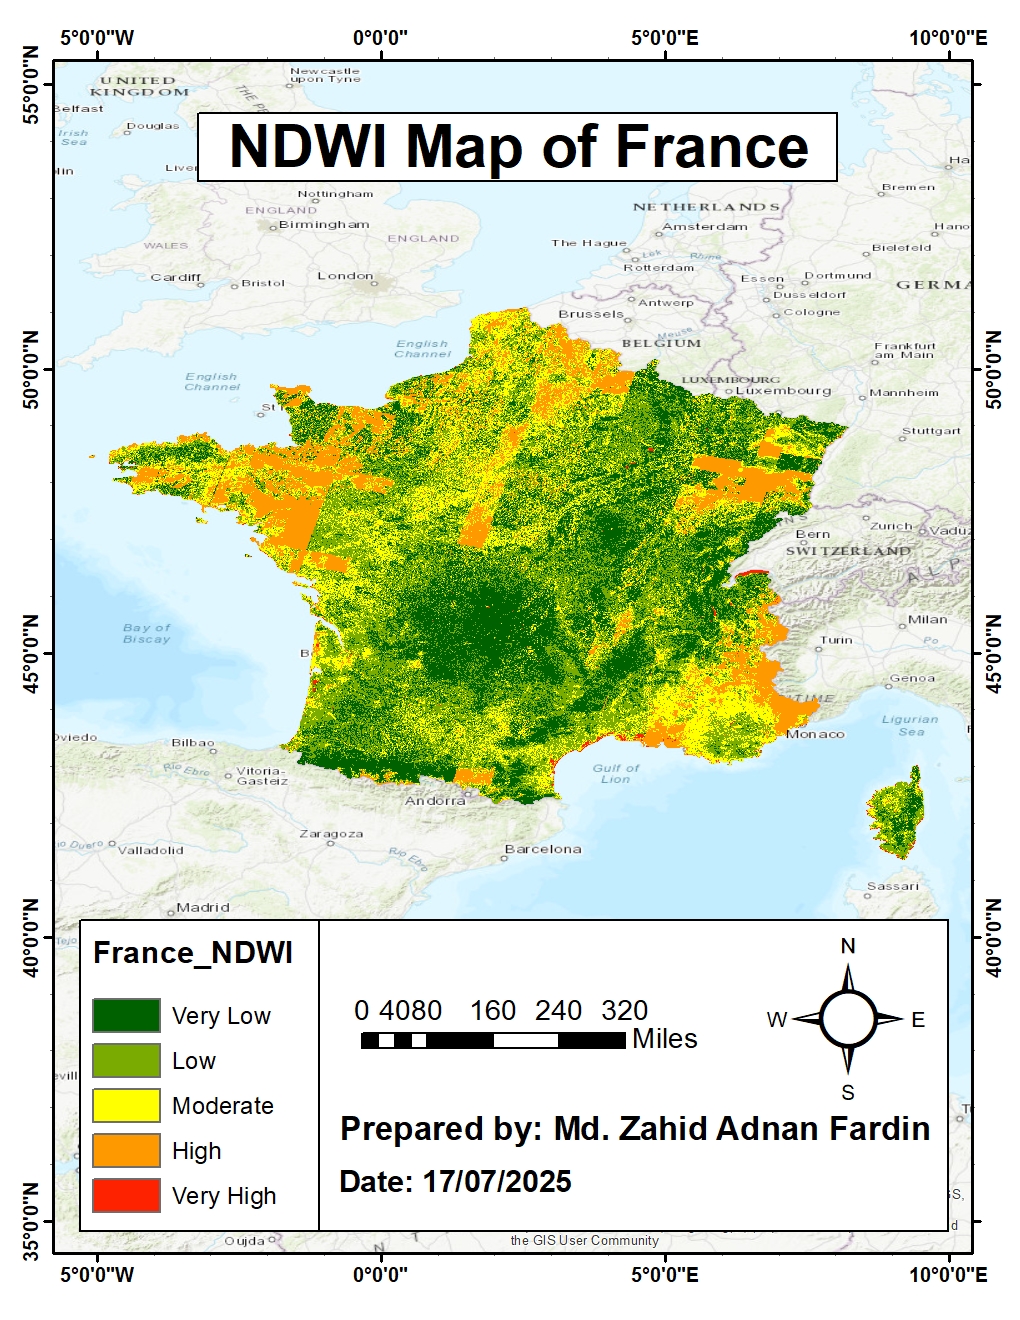
A Normalized Difference Water Index map of France, classifying surface water content across the country from very low to very high.
Further details and results about the projects I have worked on can be provided upon request.
Skills & tools
GIS & Remote Sensing
- ArcGIS
- Google Earth Engine
Hydraulic & Hydrologic Modelling
- HEC-RAS
- HEC-HMS
- EPA-SWMM
- GeoSWMM
- Delft 3D
- EPANET
Field Data Collection & Reporting
- ADCP & WinRiver 2
- Python
- Technical Reporting
Open to work opportunities & graduate scholarships.
Reach out about Civil and Water Resources Engineering positions, or fully funded Graduate Programmes.